Monitoring Pathway with Prometheus
In this tutorial, you will learn how to monitor a Pathway application with Prometheus. This will allow you to reliably oversee the execution of your streaming pipeline.
Proper monitoring of Pathway application is inevitable for business-critical production deployment. One has to ensure that all the current and previous bottlenecks, like drops in latency and throughput or any anomalous behaviors are easily identifiable, so that all the issues can be immediately resolved. This can be achieved by integrating Pathway with Prometheus.
The setup is straightforward. You can set up your own monitoring process by following these steps:
- Download and unpack Prometheus from its official website
- Configure it to scrape the Pathway endpoint by editing the
prometheus.ymlinside the unpacked directory
scrape_configs:
  - job_name: pathway
    scrape_interval: 5s
    static_configs:
      - targets: ['localhost:20000']
20000is the default Pathway monitoring http port. You can configure this setting via thePATHWAY_MONITORING_HTTP_PORTenvironment variable.
You can monitor all the processes (when running in multi-processing mode) by adding numbers to the port (e.g. 20002 corresponds to the 3rd process)
- Run prometheus
./prometheus --config.file=prometheus.yml - Run any Pathway program with http monitoring enabled i.e. with
pw.run(with_http_server=True), e.g.
import time

import pathway as pw


class InfiniteStream(pw.io.python.ConnectorSubject):
    def run(self):
        while True:
            self.next_json({"value": 1})
            self.commit()
            time.sleep(0.100)

class InputSchema(pw.Schema):
  value: int

if __name__ == "__main__":
    t = pw.io.python.read(InfiniteStream(), schema=InputSchema, format="json")
    t = t.reduce(sum=pw.reducers.sum(t.value))
    pw.io.null.write(t)
    pw.run(with_http_server=True)
- Your metrics should now be available at http://localhost:20000/metrics
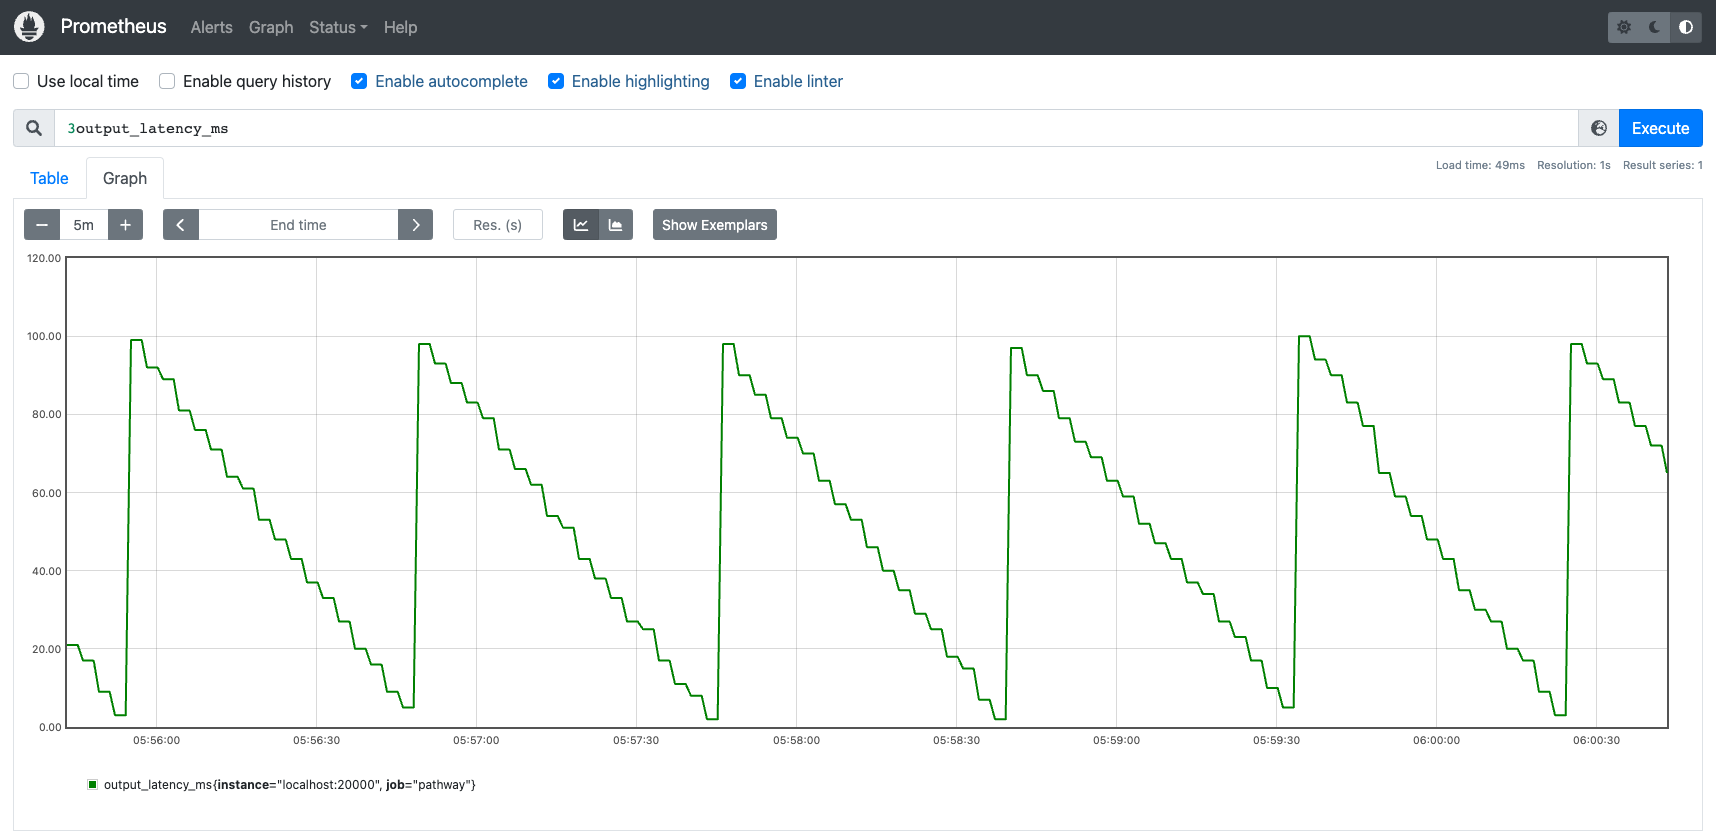
Finally navigate to the Prometheus interface and query for some metric, e.g. http://localhost:9090/graph?g0.expr=output_latency_ms&g0.tab=0&g0.range_input=5m (9090 is the default Prometheus port) to verify that everything works correctly.